COINMARKETDESK.COM
Get Free Crypto Analysis
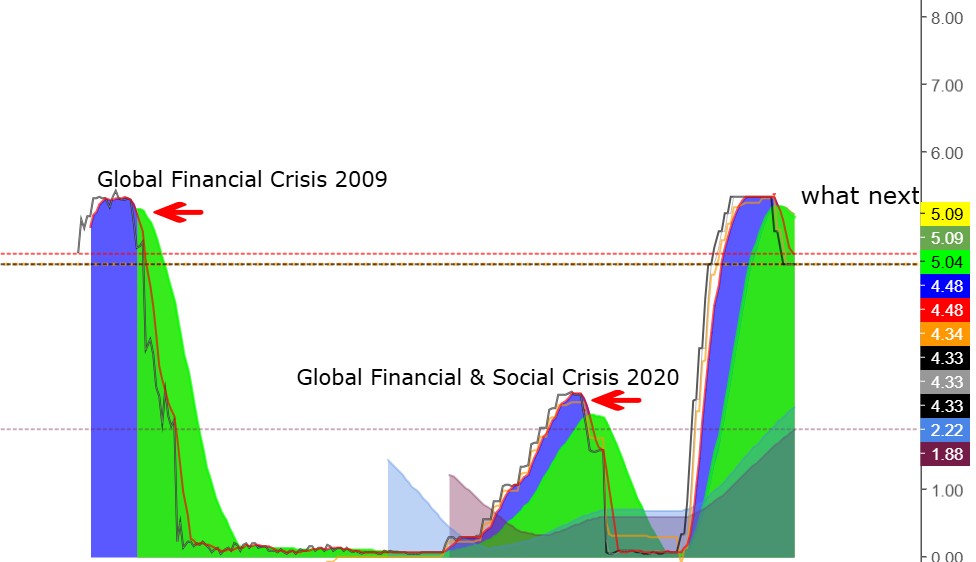
GLOBAL CRISIS-CRISIS Chart
Last Update : 2025-04-04 07:52:36
Legend
| # | description | |
|---|---|---|
 |
Close price/latest price. | |
 |
The price must always be above this line price to continue up. If the price is below this line then the price tends to fall. | |
 |
This line shows the price is in an uptrend or downtrend. If the price is above this line then it is an uptrend and if it is below it is the opposite. | |
 |
This line shows the pattern that is occurring. | |
 |
These waves show whether the price is in a downtrend or uptrend phase. If the price is within the wave then the price will tend to fall and if the price is above it then the price will tend to rise. | |
Analysis
Global Crisis Monitoring
This chart is using Federal Fund Rate data to know when crisis will accur. As you can see now the chart has shown the beginning of the crisis movement. Back to the history 2009 and 2020 there is a same pattern for early movement. In 2009 the reduction in interest rate started from 2007. It took 2 years. In 2020 the reduction in interest rate begins in 2019 (takes 1 year). What about this year 2025 ? this depens on how quickly The Fed lowers interest rate !
coinmarketdesk.com will update this indicator to give you more information. Don't forget to bookmark this page.